Assay & Application Notes
ELISA Workflow: A walkthrough with Absorbance 96 ELISA Plate Reader App
Introduction
The ELISA (enzyme-linked immunosorbent assay) is an indispensable and highly versatile tool in the toolbox of researchers in the fields of molecular biology, biochemistry, and diagnostics worldwide. What sets this apart is its innate simplicity and efficiency in detecting the presence of antigens in biological samples. There are different types of ELISAs to choose from, depending on your research needs. Nonetheless, the fundamental procedure involves four key stages: coating, blocking, detection, and readout, which you may already be familiar with.
In this article, we won’t delve into every aspect of the ELISA workflow; instead, we will focus on the last stage – the readout specifically with the Absorbance 96 App. When you are ready with your ELISA plate preparation, all that remains is connecting your computer to the Absorbance 96 ELISA plate reader and launching the Absorbance 96 App, a user-friendly and freely downloadable software. It acts as your companion, assisting you seamlessly through the entire readout and analysis process, from initial setup to obtaining instant results. Let’s now explore in detail the various steps that allow you to measure your ELISA readout easily.
Step 1: Intuitively Define Workflow Parameters For ELISA Assay
Easily navigate the software to select your desired reference and sample wavelengths for signal detection. You can also choose the “reference wavelength” option for sequential signal measurements, allowing you to get more insights into your ELISA assay.
Step 2: Easily Select Readout And Evaluation Methods With In-built Features
Whether you are running an end-point or kinetic ELISA, the Absorbance 96 App allows you to select your preferred readout method. If you enable the “rapid kinetic measurement” option you can obtain signal data and results at approximately 3-second intervals, which is ideal for kinetic studies.
In the evaluation section, you can effortlessly choose an evaluative method for readout and data analysis. The built-in quantitative evaluation method provides convenient fitting options like point-to-point, linear Regression, 4PL regression, or 5PL regression for generating standard curves and data analysis. You don’t have to deal with lengthy calculations or Excel sheets. Alternatively, you can manually input curve parameters to load a standard curve from a previous assay with just one simple click.
Read more: The standout features and advantages of Absorbance 96 ELISA reader compared to others
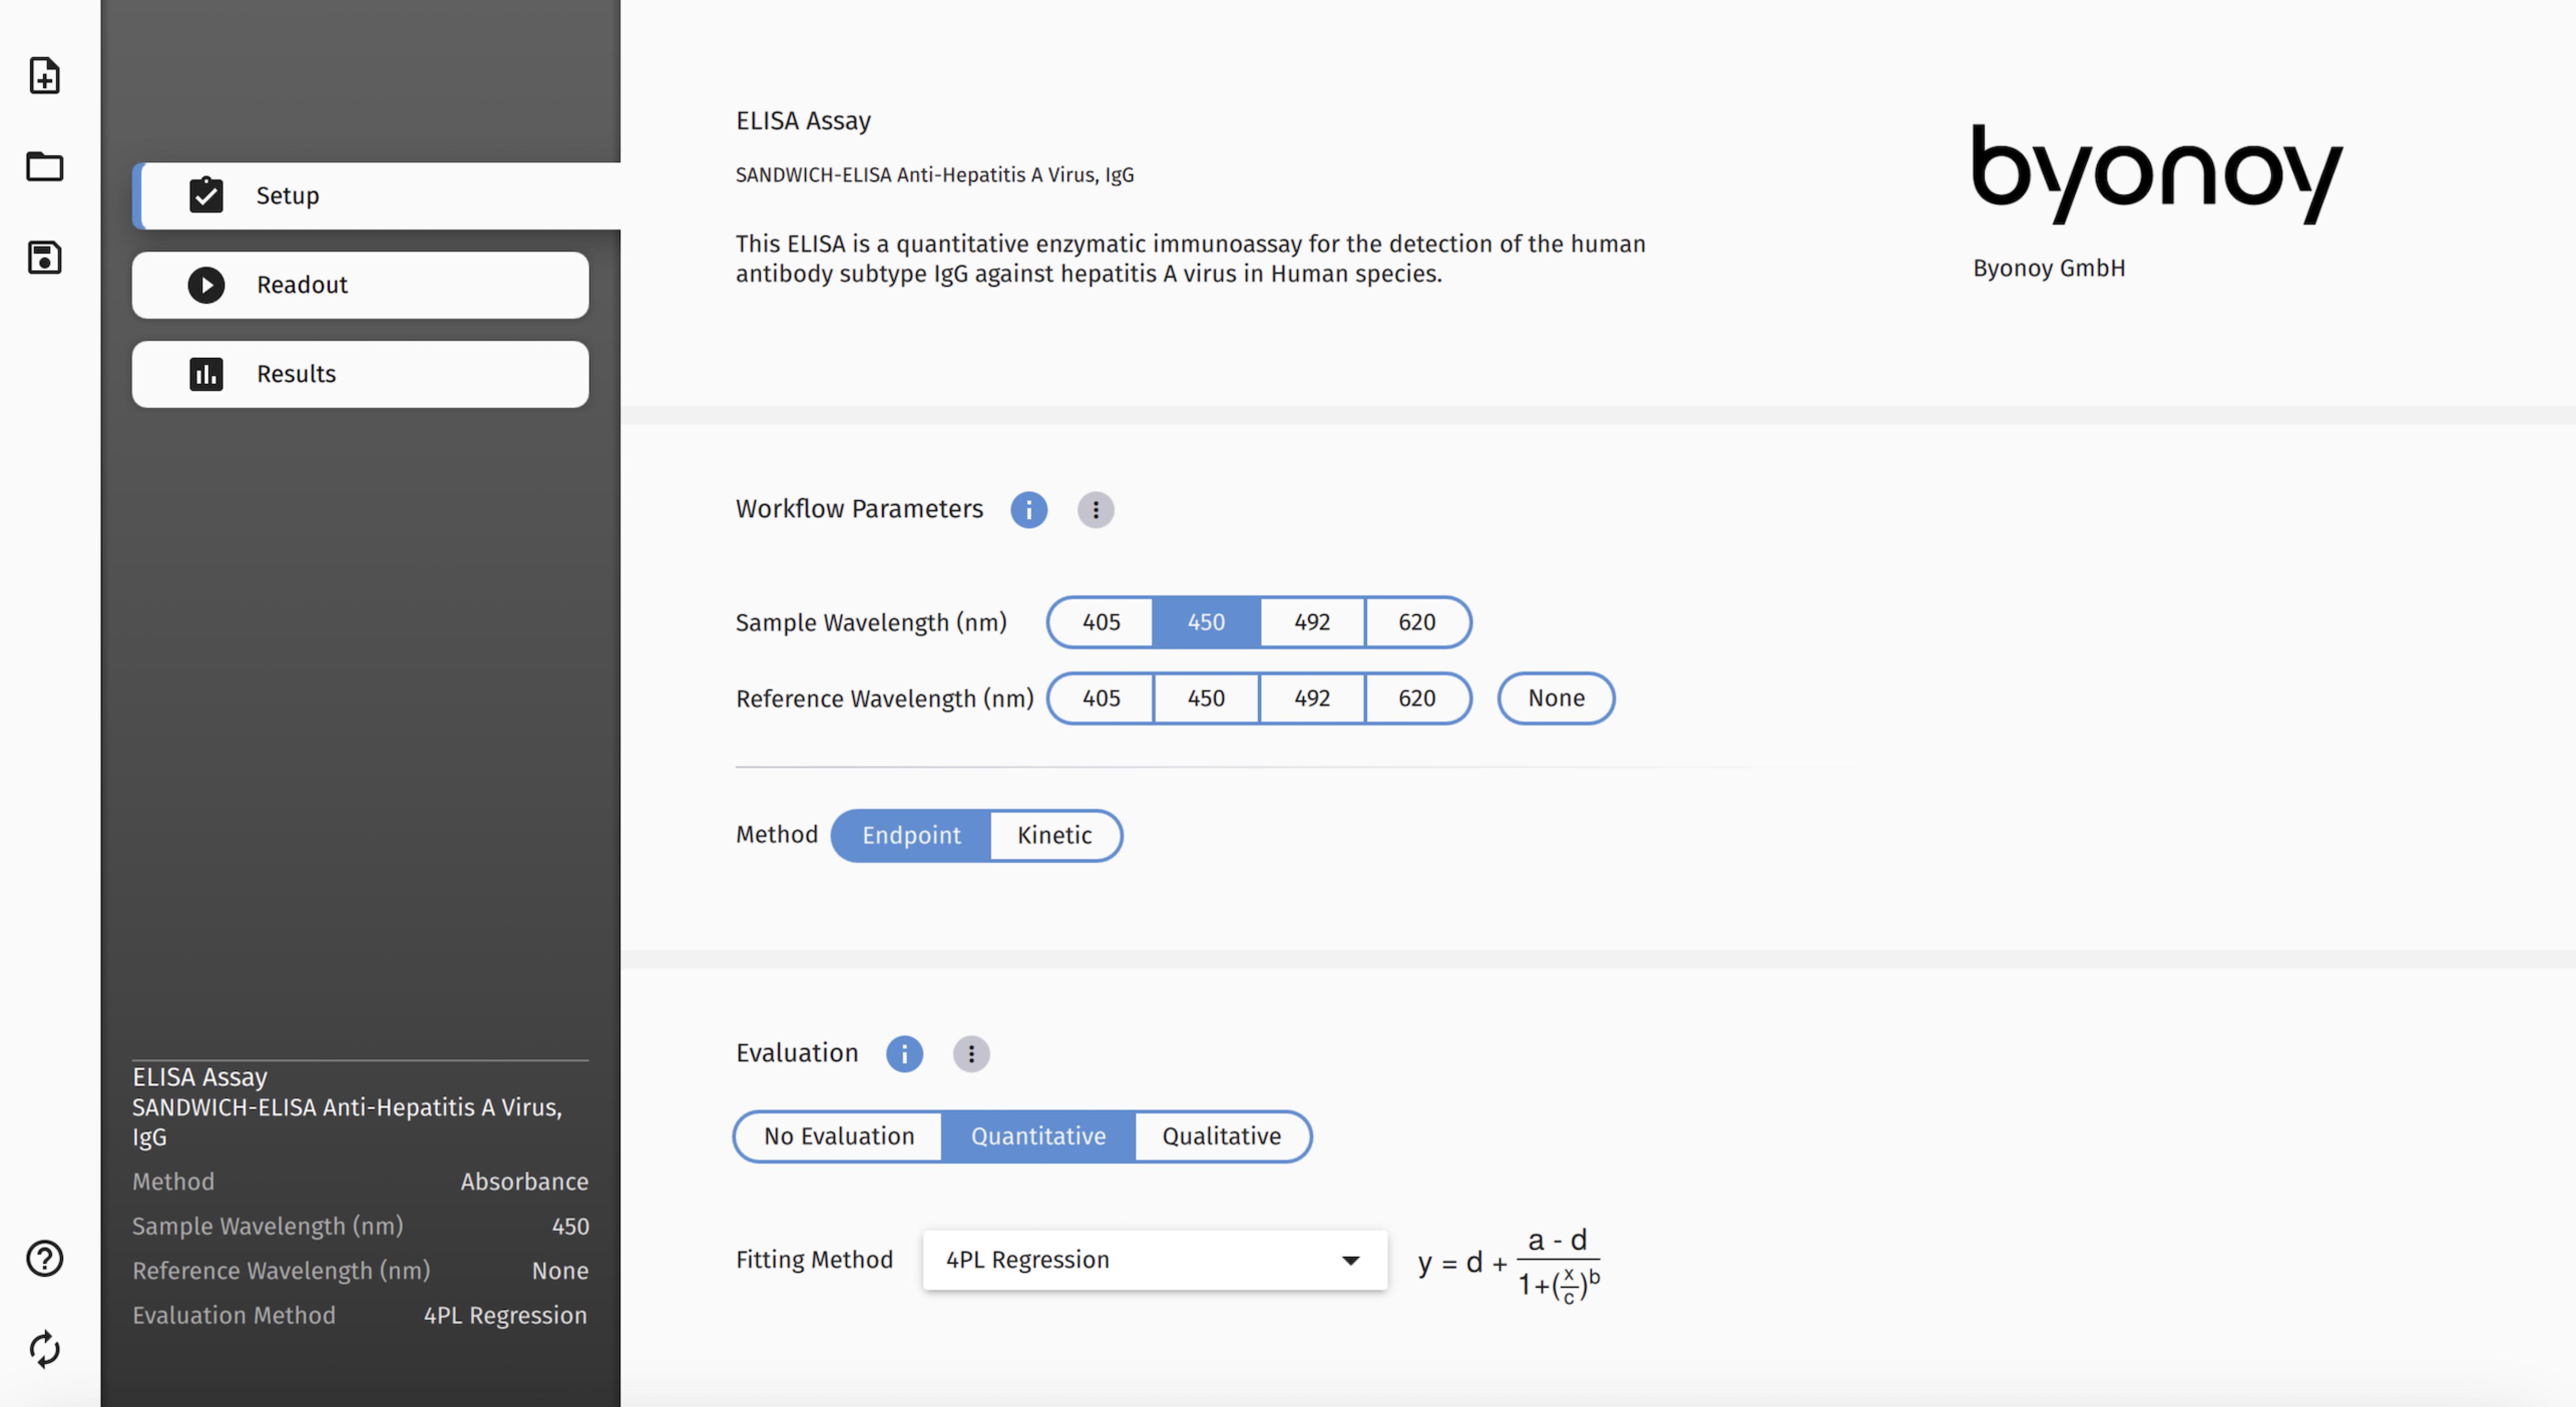
Fig 1: Assigning workflow parameters and evaluation methods for the ELISA assay is easy with the Absorbance 96 App.
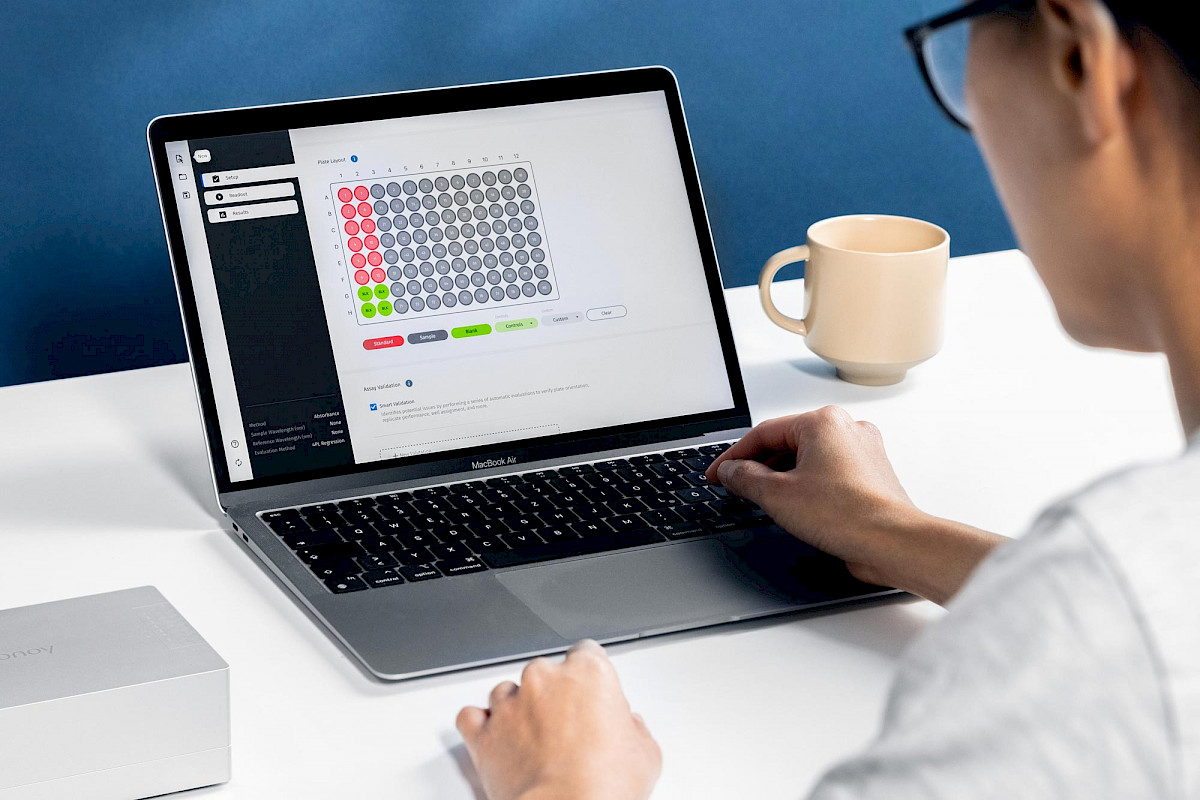
Step 3: Playfully Design Your ELISA Plate Layout
Using a user-friendly click-and-drag interface, you can easily designate your plate layout, specifying samples, blanks, controls, and standards as your favorite color labels. You can also set duplication patterns to assign multiple replicates for both samples and standards. Additionally, while conducting competitive ELISA, designating a specific well as a B0 control is a breeze, and it will be automatically factored into the readout and data analysis.
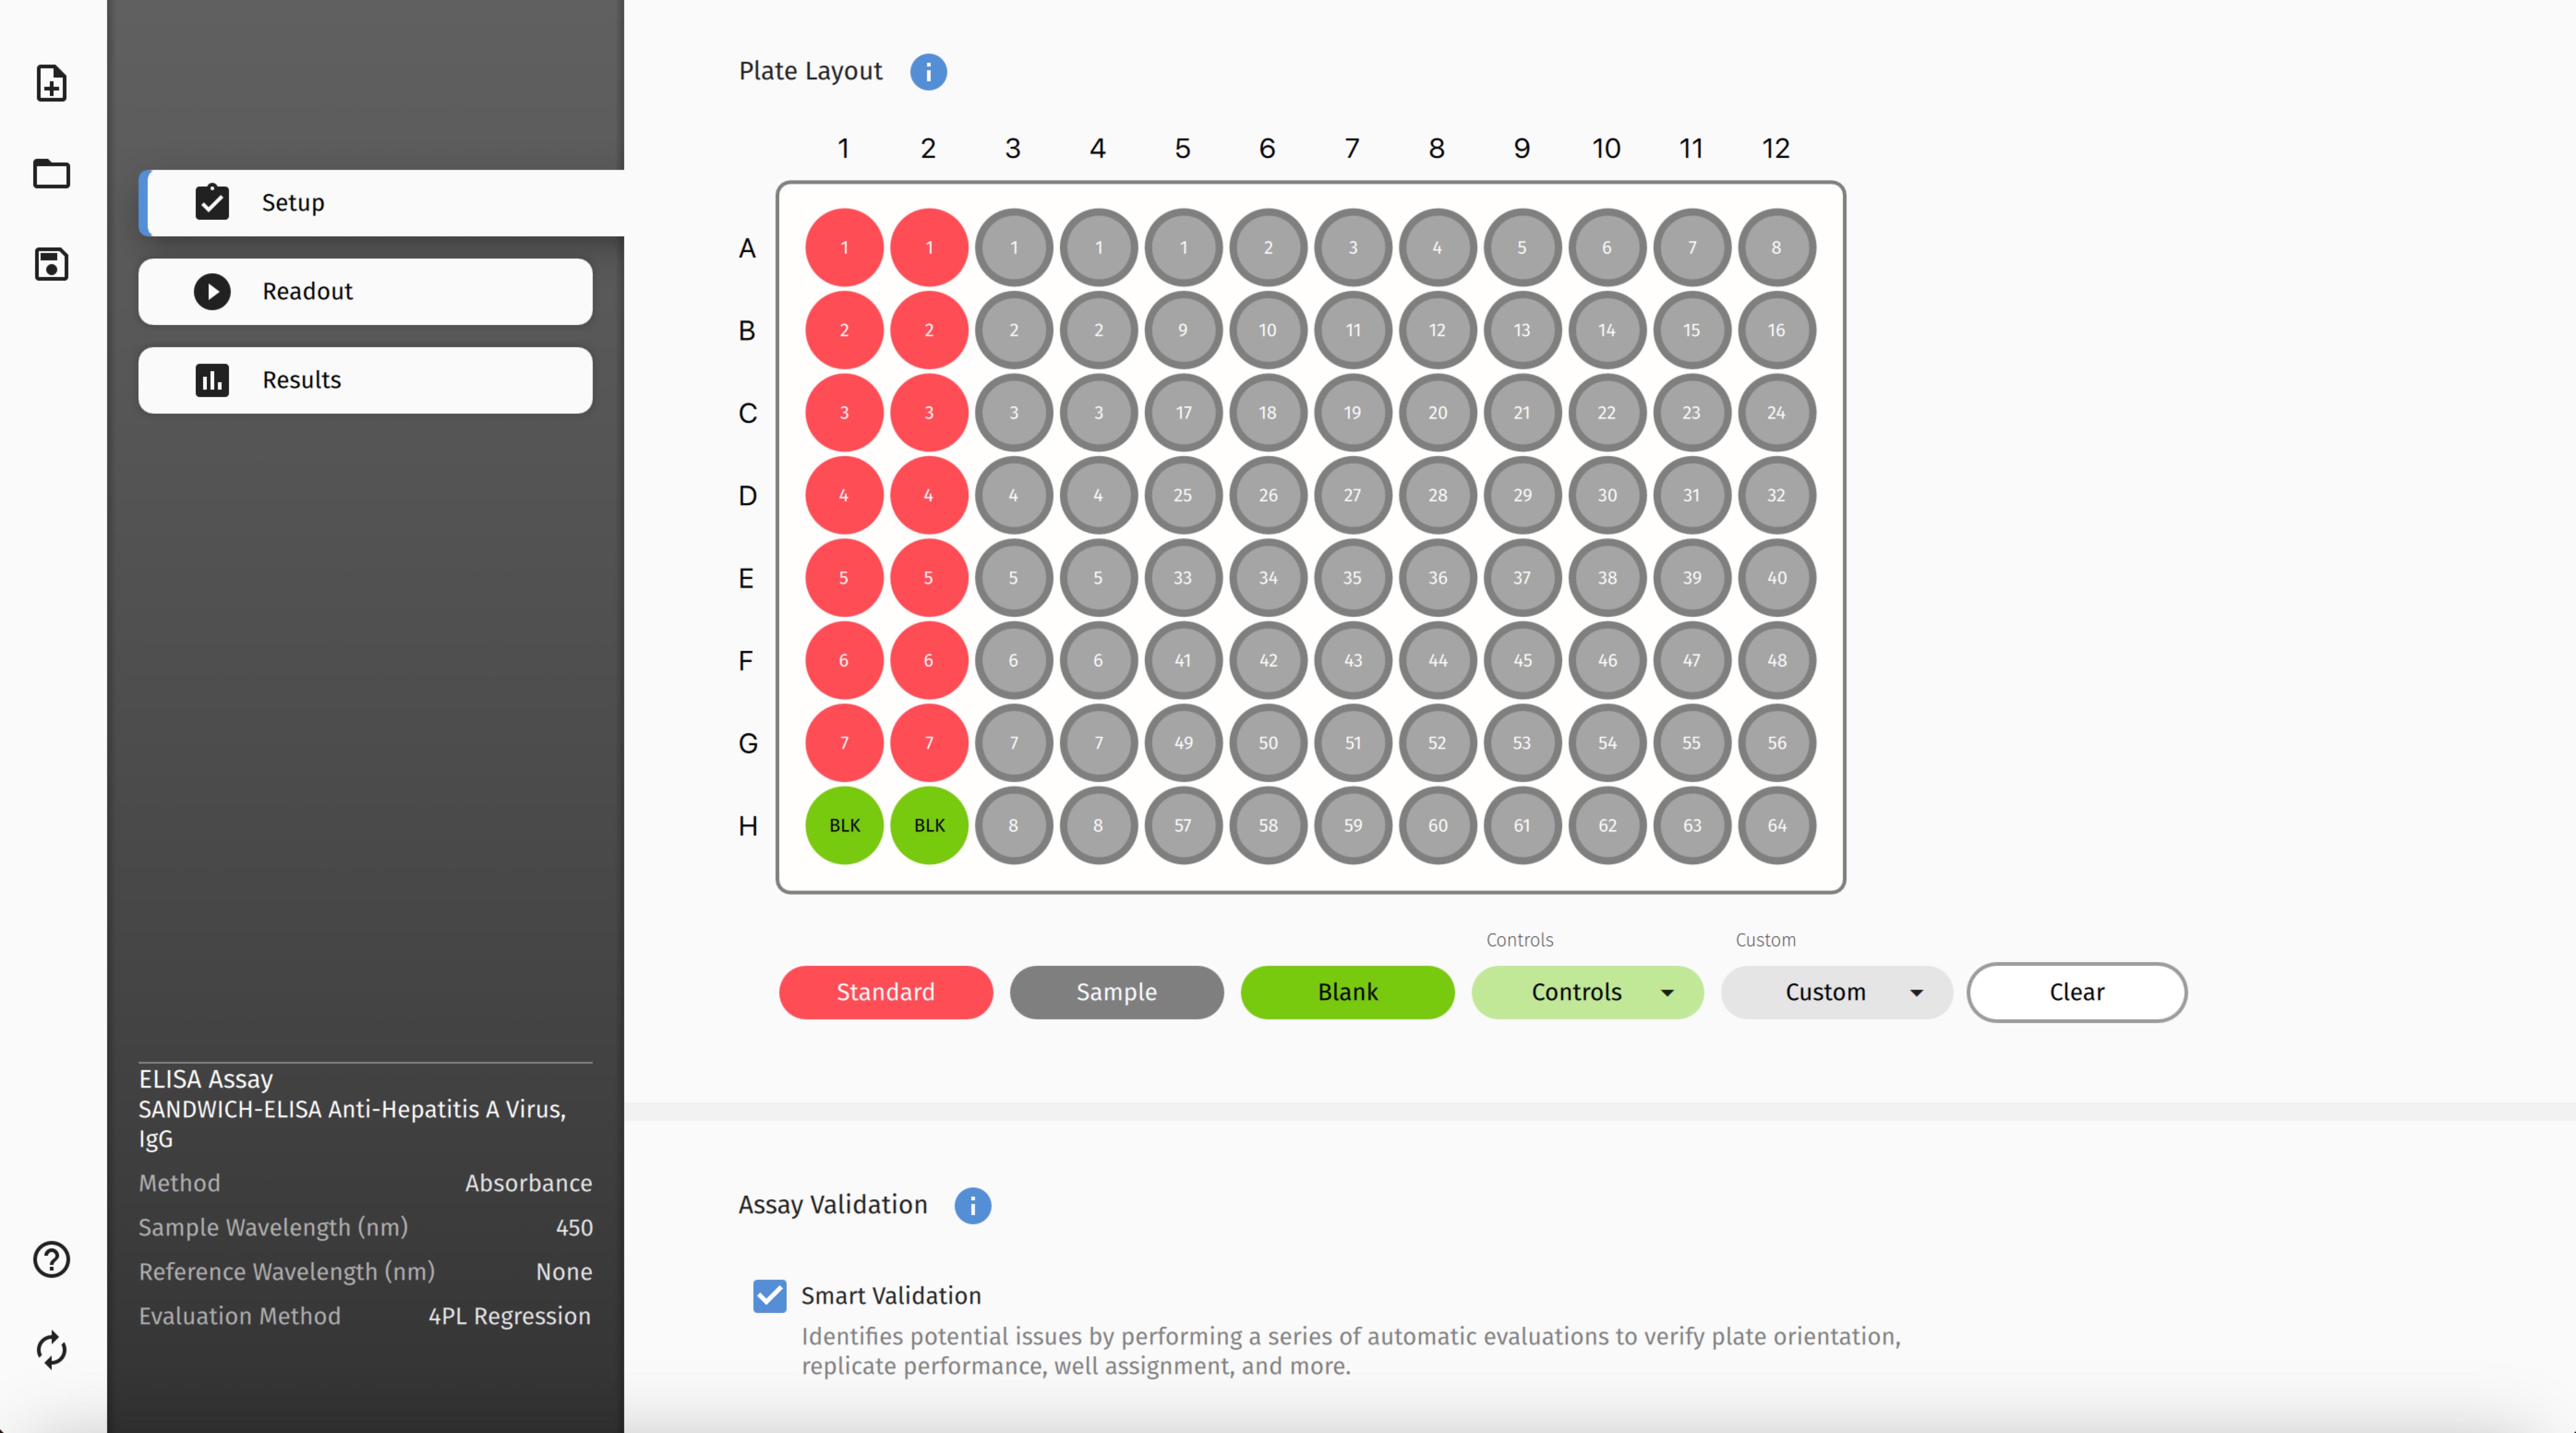
Fig 2: You control your plate layout and define samples, controls, and blanks as you like in a user-friendly way.
Step 4: Effortlessly Create And Save Your Own ELISA Protocol
After configuring all the workflow parameters for your ELISA experiment, you have the option to save these settings as protocols. This means you can easily load these predefined protocols for repeat assays in the future, eliminating the need to reconfigure settings each time. Viola!
Step 5: Get Instant Readout And Results With The Absorbance 96 App
Now, it’s time for the ELISA readout and results, the Absorbance 96 App will smoothly walk you through this process. You simply insert your ELISA plate to begin the measurement, and then sit back and relax while the app takes care of the rest. Once the run is complete, the results are automatically calculated and presented within seconds. For example, values like blank, NSB (non-specific binding), or S0 are subtracted automatically to provide the corrected data in the results section.
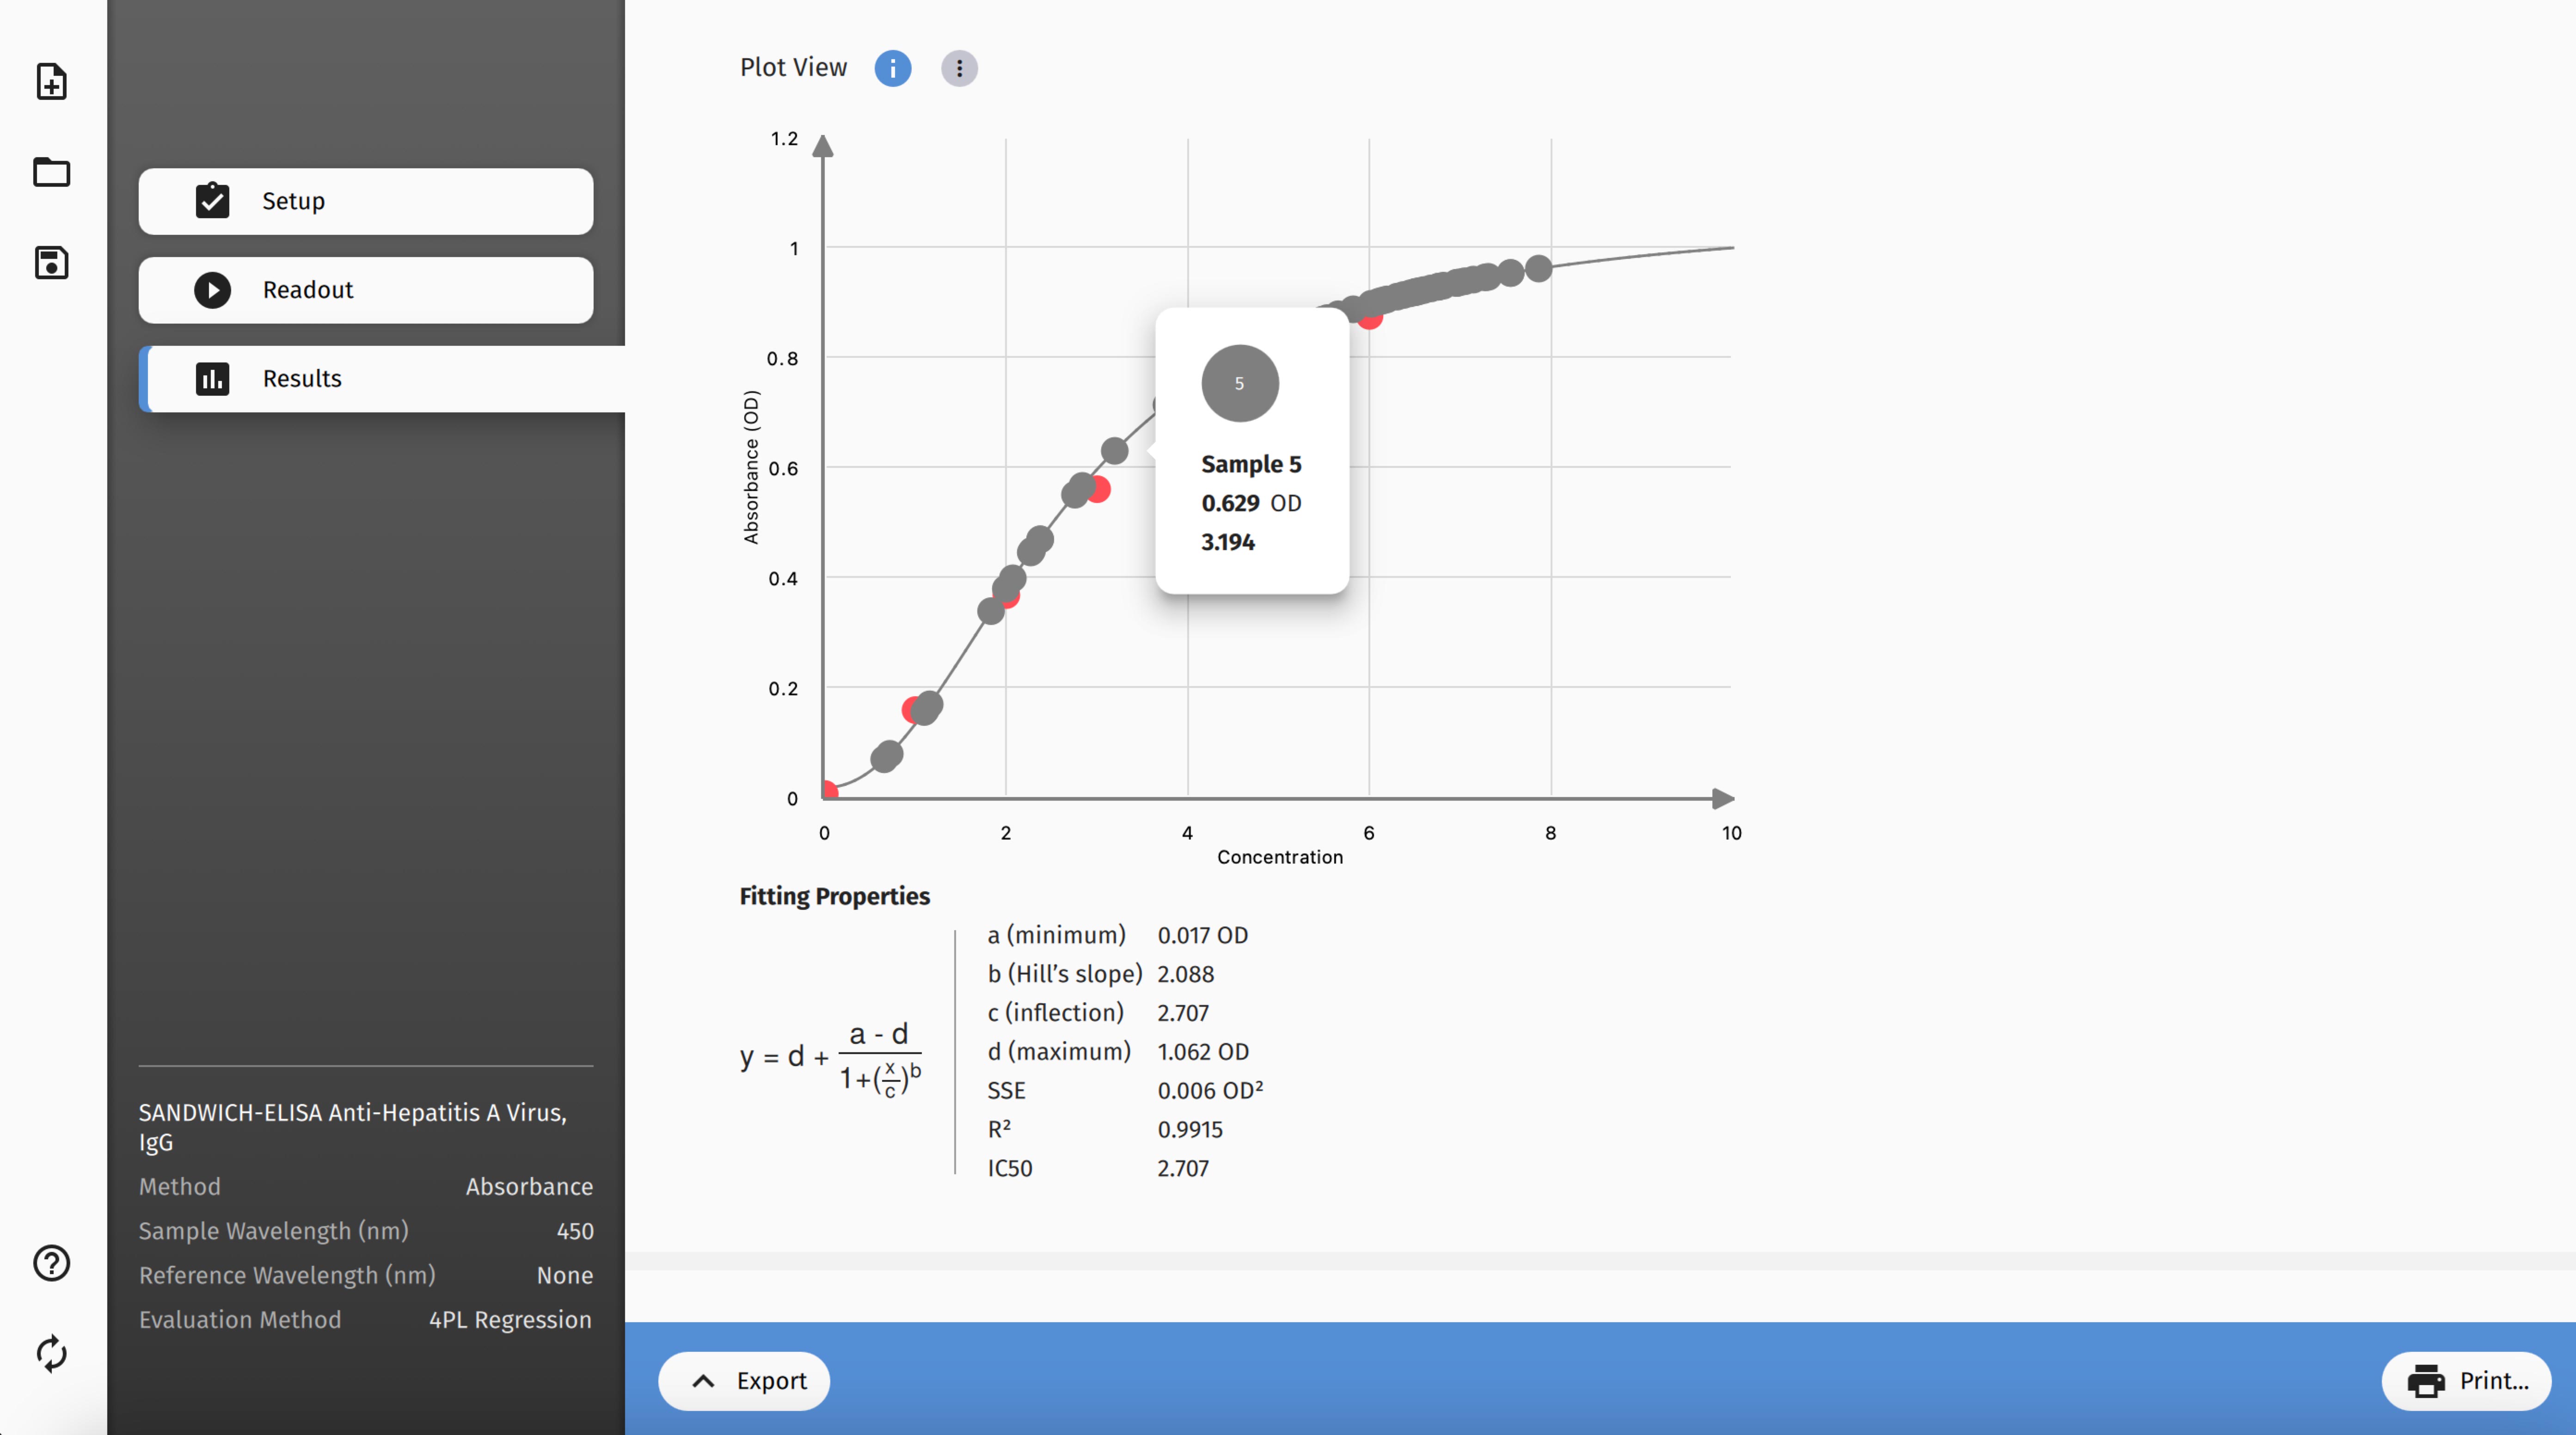
Fig 3: Get readout and data analysis with detailed insights immediately.
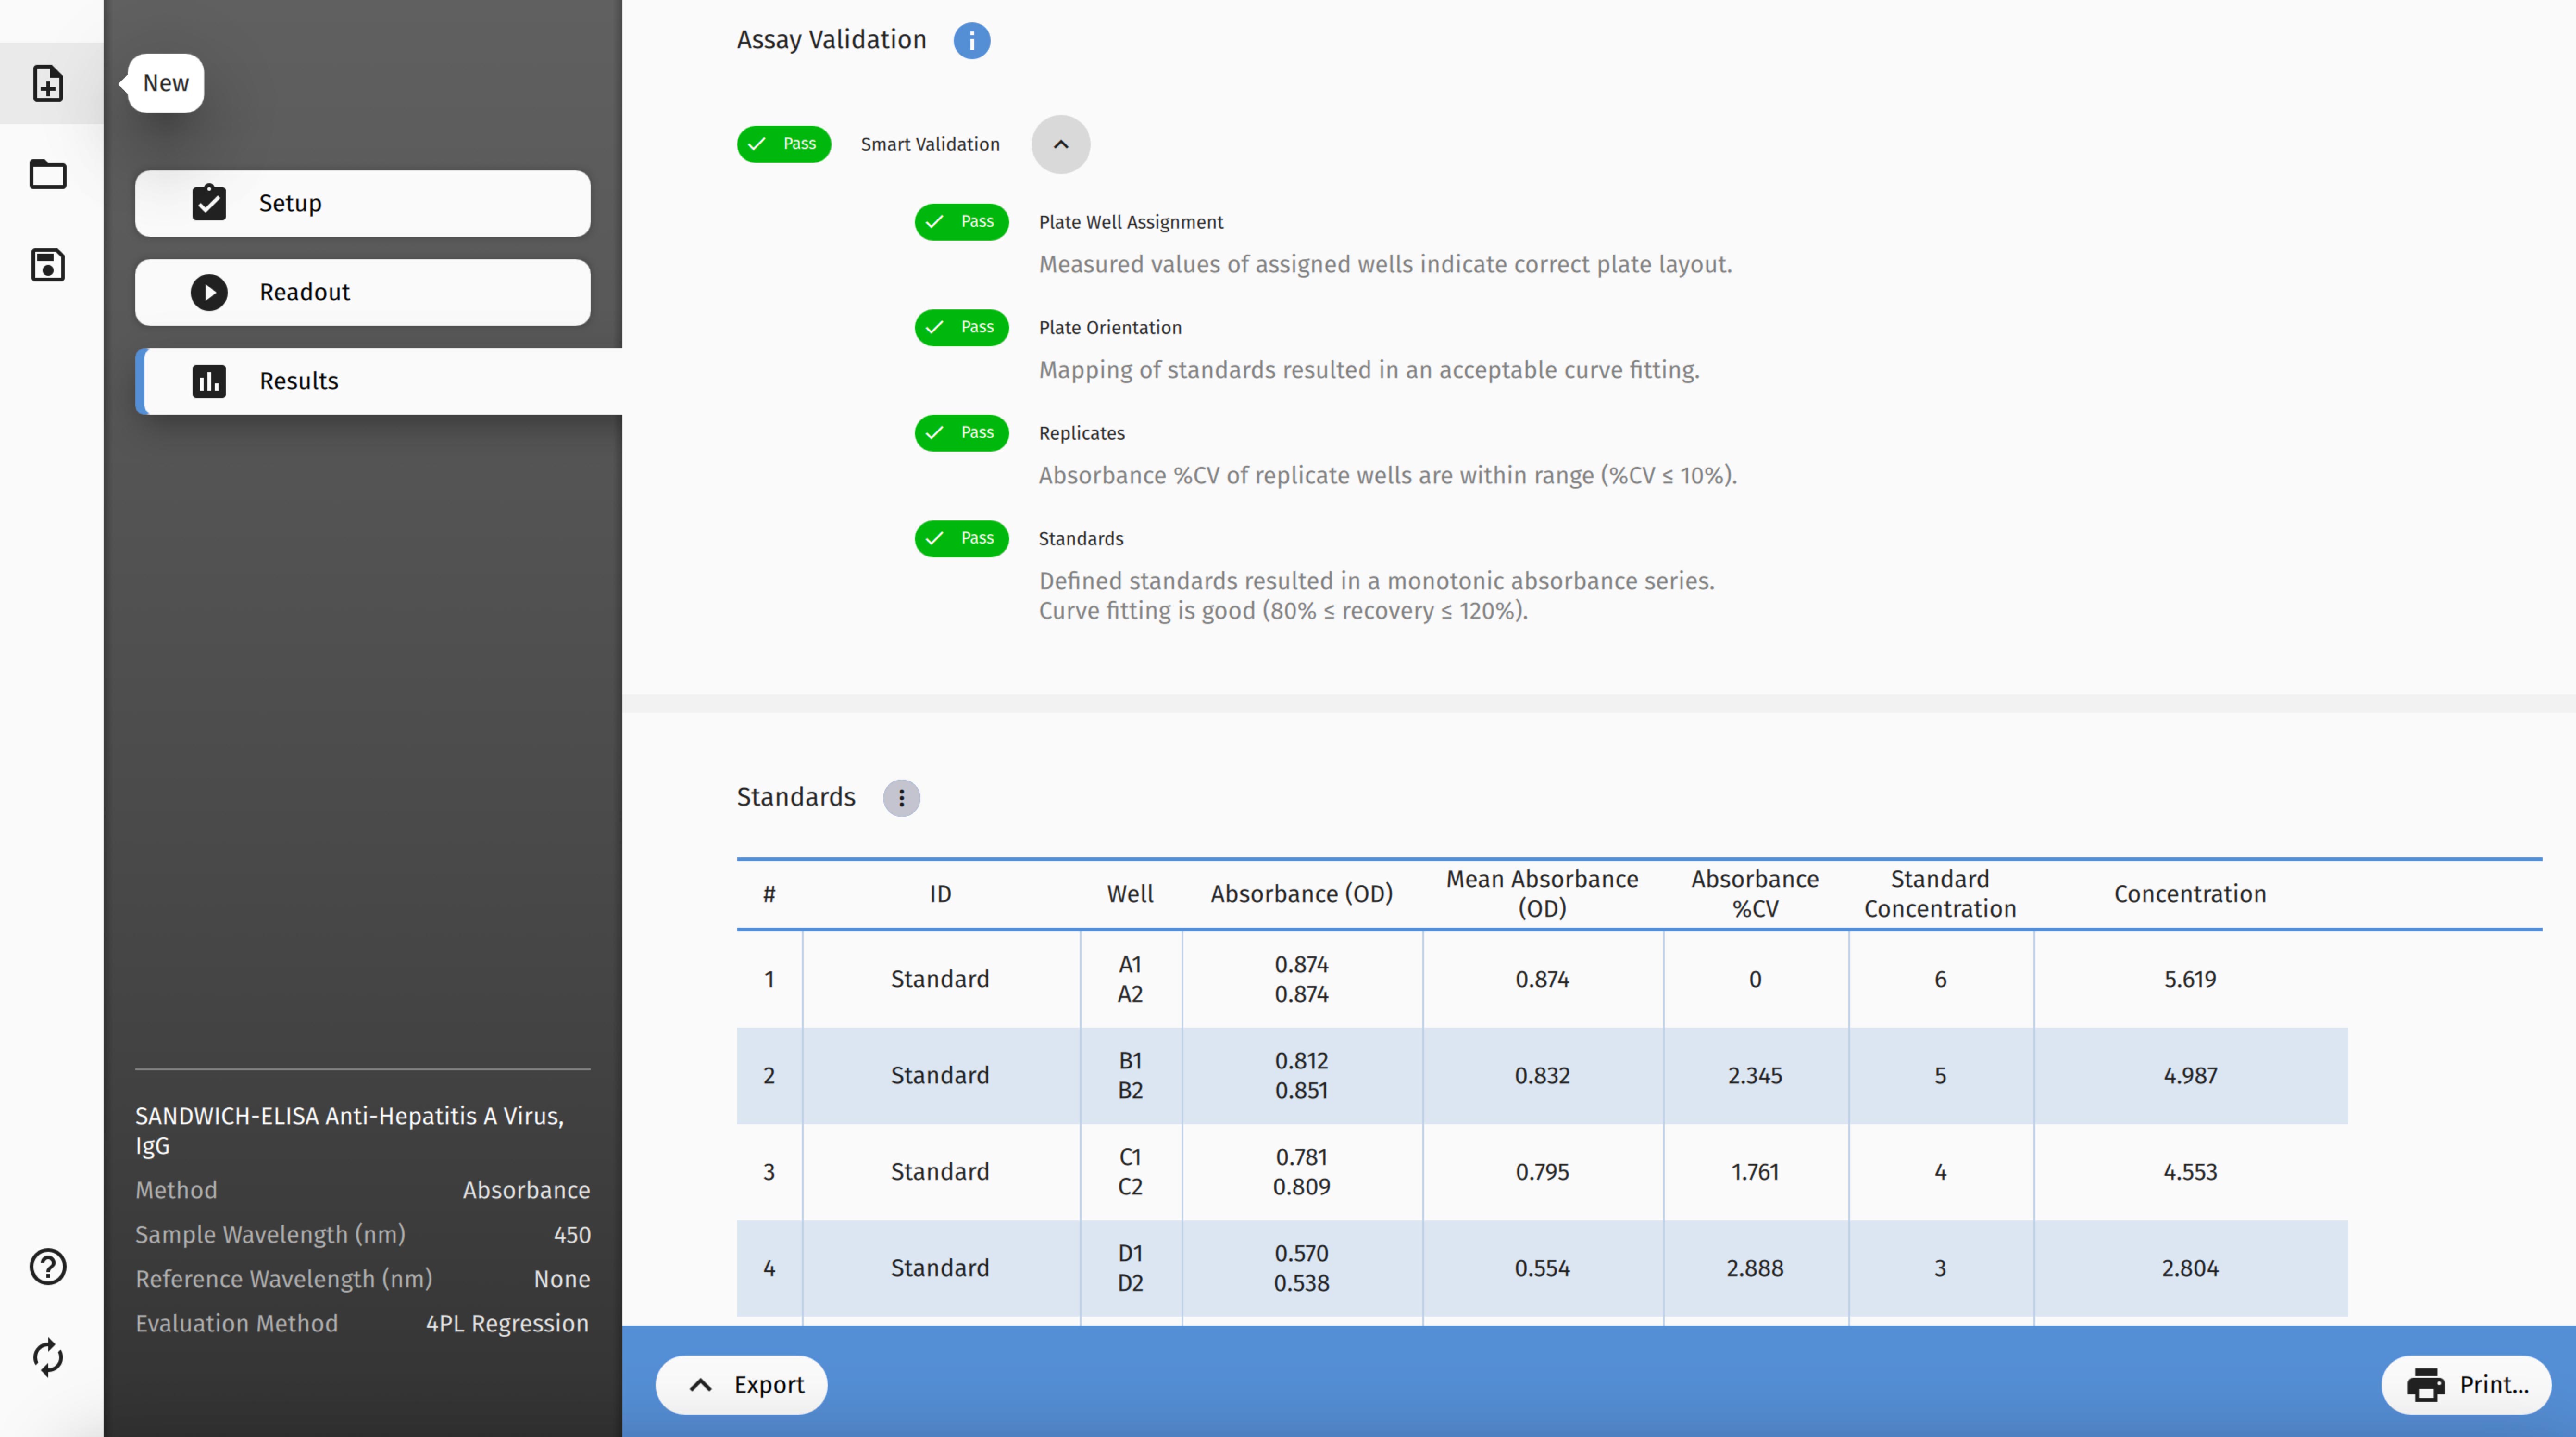
Fig 4: Assay validation functionality enables you to keep an automatic check on your data reliability.
Not to forget, the results are presented in different formats for your ease. In the plate view format, you can get an overview of the optical density (OD) values for each well on the ELSA plate. In the graph view format, your data is visually displayed based on the preselected evaluation method. For quantitative evaluation, a standard curve is generated using your chosen fitting method. With this standard curve, the app automatically calculates and displays the concentration of each sample on your ELISA plate. There you go! And, at the end, you can export these results as a PDF or CSV file for your record or further analysis.